Measurement & KPIs For Software As A Service - Part 1
Peter Drucker is widely considered to be the finest management thinker of all time. The quote below is so simple and so self-evident it has become one of the most famous sentences in business although in fact it applies to almost any endeavour.
"If you can't measure it, you can't improve it." - Peter Drucker
I talked in my previous article about some of the core outcomes of a focus on customer success:
- Value realised
- Customer satisfaction
- Renewal rate
- Expansion rate
- Advocacy n its various forms
We can measure all of these with varying degrees of certainty and companies should capture and act on the core Key Performance Indicators (KPIs) attached to each. In this post we’ll look at value realisation as this is such an important area to understand and to track correctly.
Value Realised
Measuring value realised from SaaS platforms can be done on a hierarchy. The further up the hierarchy you are able to attribute results to your solution the greater level of confidence you have when discussing value being delivered with your customers. Let’s look at each in turn.
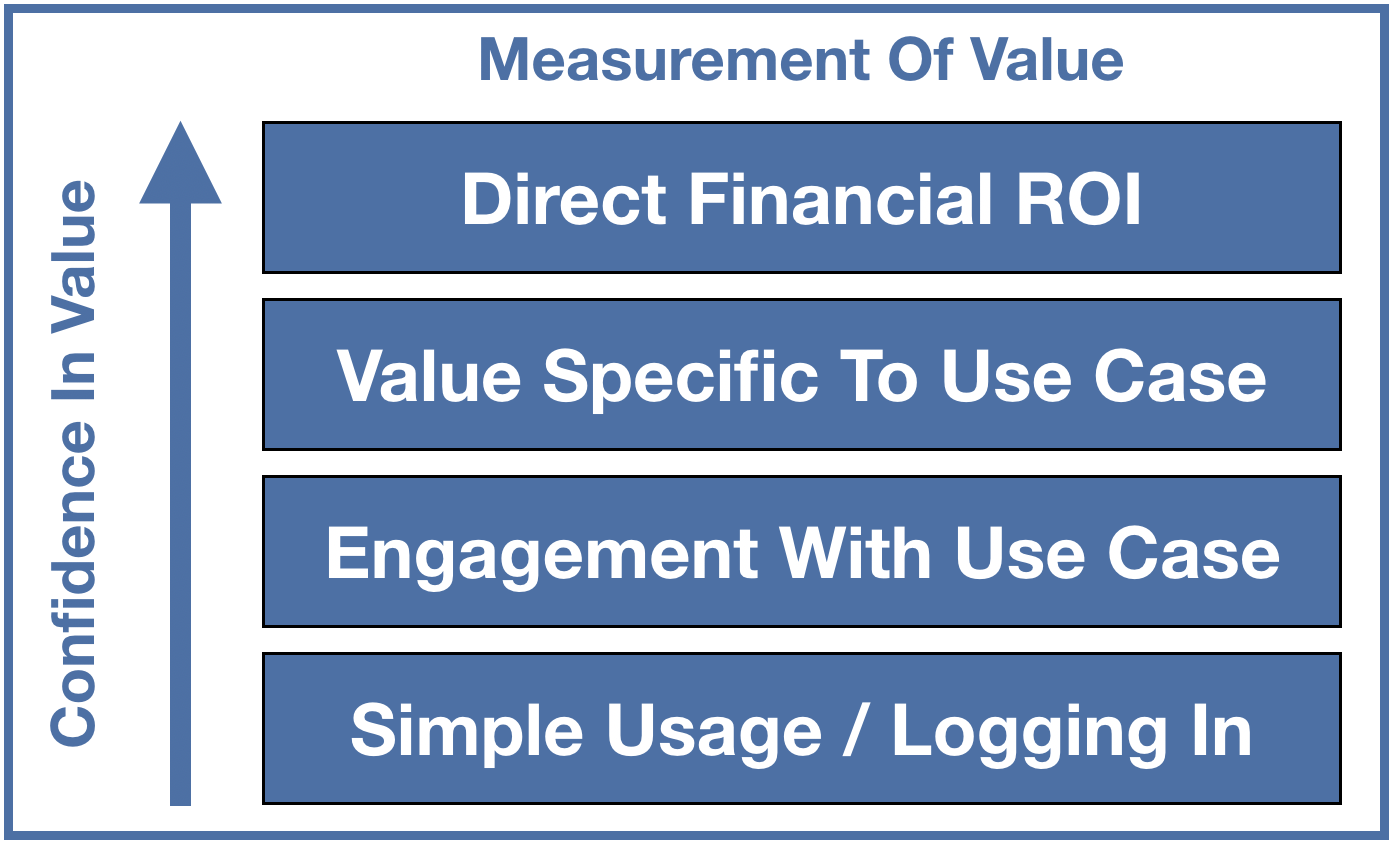
Simple Usage / Logging In
At the bottom of the hierarchy is the simplest measure and here there are two main forms of usage data. Firstly the percentage of users deployed of those licensed and secondly the percentage of users logging in to the system over a period of time.
For example, in the case of a CRM system we can break these down with the following simple examples.
The customer has licensed 1000 users. Of these 460 have been allocated to users. Assuming the KPI we create is called % Users Deployed then in this case its value is 46%. This is an incredibly simple measure and in terms of value realised tells us almost nothing. However it is a vital measure to track. In the example given 54% of the licenses sold are unused, something commonly known as shelfware. Understanding why this is the case is critical. For example if the customer is in the middle of a phased rollout of your solution and has concrete plans to deploy the unused 54% then it’s a measure that just needs to be kept in view to confirm the planned deployment happens. However, a mature customer discovered to have this level of shelfware has a KPI that needs managing. Plans need to be made to work with the customer to find ways to consume the unused licenses or at renewal time there is a very good chance they will not be re-purchased.
Of the users licensed it’s equally important to understand basic activity levels. For example you might choose to track the % of users who have logged in at least once over the course of a week and done something. In this case the KPI might be called % Weekly Active Users.
(As an aside a choice presents itself at this point. Carrying on the above example if we assume in the week being measured 230 users logged into the solution then we either have a % Weekly Active Users of 50% (230 from 460 deployed) or 23% (230 from 1000 licensed) depending on how the KPI is defined. As long as you are clear on the definition which you choose is largely a matter of how you wish to represent the KPI.)
It’s obvious again that even though the KPI doesn’t speak to value realised in any meaningful way it’s again a vital measure to track. Getting users onto the system is so clearly a key step in achieving value that it’s very important to ensure the percentage of active users is tracked and managed aggressively as part of the overall strategy to realise maximum value from the customers’ investment in your solution.
Engagement With Use Case
Having successfully deployed users and then got them logging in the next step is to get your users engaging with the system in the intended way. This is where KPIs begin to get specific to individual solutions and so will vary considerably in detail. It’s also where customers can begin to see a return on the investment they have made.
To take the relatively simple example of an expenses system, one intended use case is to allow employees to quickly and easily enter their expense claims. An obvious metric to track would be a KPI related to the number of expense reports created. Regular creation of expense reports by every employee on the system would certainly confirm that the system was being used as intended. If historic figures exist to indicate how many expense reports are created on average per month per employee you would expect a KPI for the new system to show similar numbers. Tracking it early on will highlight issues with adoption, perhaps for example the system is confusing to use and so is being avoided by employees who fully understood the previous system. This may show up as lower than expected average numbers of expenses reports being created in the early stages of the system’s deployment. Once the issue is addressed then this should show up in the KPI quite quickly.
What’s important with this category of KPIs is that they are clearly specified, can be reported on easily by the system and relate directly to the intended use case or use cases for the system so that effective tracking can be started early allowing problems (or successes) to be spotted and acted on.
Value Specific To Use Case
In some cases engaging with the intended use case is a reasonable proxy for value but in most cases you can define metrics that get much closer to the value being delivered.
For example almost certainly in the case of an SaaS expenses system something less sophisticated is being replaced in order to improve on one or more aspects of the previous system. Perhaps it was time consuming for users to create an expense report, or it was prone to error leading to time wasted in finance checking and rejecting expense reports. Or perhaps the customer wanted to provide a mobile portal to allow its employees to make use of spare moments in the day to capture expense items improving their efficiency. All of these would have a value to the customer and help to justify the ongoing annual investment in new system if the value being realised can be demonstrated. Assuming the expense system provides the reporting data then the following are examples of what can be tracked and compared to the old system showing where value is being realised specific to the use cases deployed:
- % Rejected expense reports (this should reduce compared to the prior system)
- Average time spent to create an expense report line item (this should reduce compared to the prior system)
- % Expense items created on the mobile client (ideally this shows a healthy % of the total)
Here what is key is for the vendor to establish this set of metrics and establish the KPIs, design into the solution the tools to allow their tracking and reporting, recommend they be used by the customer as a measure of value and have them become the focus of the customer success efforts to drive increasing value over time.
They also of course have huge value in the sales cycle. Once enough data is gathered from across the customer base then sales can provide hard evidence of the measured improvements typically delivered by a deployment of the solution when talking with prospects.
Direct Financial ROI
Super super hard to do with complete confidence. Why?
Let’s look at some of the reasons why this is so difficult. Imagine a retail customer introduces your training system which is expected to improve employee product knowledge and lead to improved cross-selling of complimentary products to the biggest selling items. You may be tracking average store revenue as a direct financial KPI which you hope to see improve as a result of this improved cross-selling.
The value specific to the use case here would be the attachment rate of the cross sell items to the big selling items. If that KPI improves then it looks like the solution has done its work, the employees would appear to have done the training, understood it and applied it successfully.
In fact it’s unlikely to be that simple. If in addition to training the company also had an in store promotion on the complimentary items, entirely likely given the focus on using this as a lever to improve store revenues, how much of the improvement would then be attributed to the promotion and how much to the training? One way to try to answer this would be to use control groups - one store only does the promotion, one store only does the training, one does neither, one does both, then compare and contrast the results. Not many businesses have the time or inclination to do this leaving uncertainty in place.
So this is a complex topic, beyond the scope of this article to delve into in much depth and one which needs very careful consideration and often detailed analysis to demonstrate. The very short example above gives insight into why this is and why this area is much more complex than the lower levels of the hierarchy to conclusively demonstrate results. However, where you can do this with confidence then you’re in a very strong position indeed come renewal time or when negotiating an expansion deal.
One Last Word : Benchmarking
It is I hope obvious from the above examples that establishing benchmark data at all levels of the hierarchy at the start of the project is very important in demonstrating value realised over time. Firstly you ideally want to compare the results of the new system to those being delivered by the prior way of doing the job, assuming something did exist. Secondly you want to establish a baseline set of KPI values for the deployment of the new system. Your customer success efforts can then focus on driving improvements in these KPIs over time allowing you to demonstrate increasing levels of value realised from the solution.